
Today I will be giving an overview of the IBB ETF and an in-depth look at how I review the healthcare sector. This morning i pulled up the daily chart and the reason I am interested in this sector is because it had a nice tail at support yesterday and while it already took out yesterdays low, it has a nice band of support slightly lower from 285-287. While price works down to that band, it gives us time to do some research on the entire sector and see if we want to long the ETF or just focus on some individual names. Below you will see the daily chart with today’s current candlestick
Daily view

Price currently broke the short-term rising trend line. One can make a case that its been inside for 3-4 days and now broke lower (small bear flag) and is now lower than that large volume spike down on May 8th. I added a more zoomed in view of this consolidation at support because it helps to see the possibility of a move back to the top of the triangle to around the 295-296. That is our current focus if this can get through yesterday’s high or fall down further into that support band
Hourly view

Now that we have our sector picked out for the short-term we can move our focus over to our current watch list. The next phase is to populate that watch list (roughly 69 names today) and sort them from strongest to weakest using only price related metrics. We will then take the top 24 and do a more elaborate filter to find some of the best names who are in a nice healthy uptrends.
Full run analysis

Zoomed in view of top 1-8

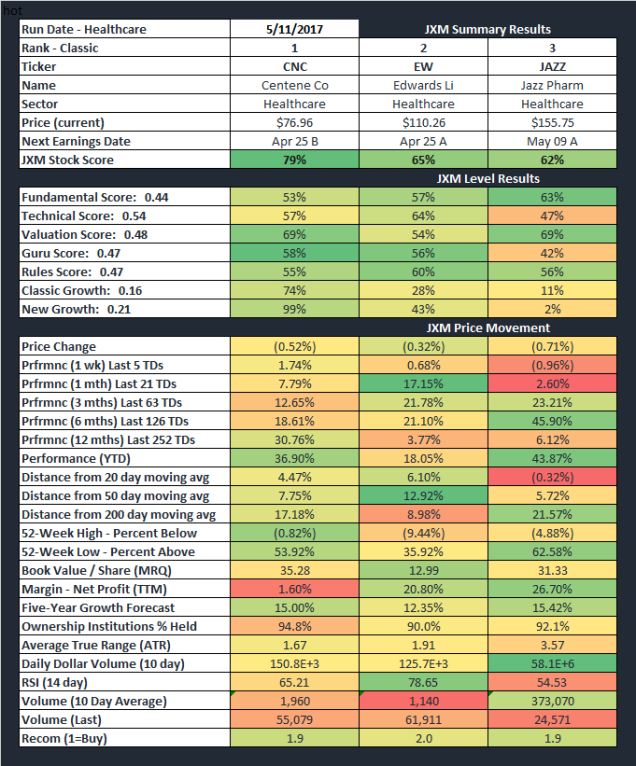
Now that we have our 24 names identified we will plug them into the JXM and see what we find.

For this review I am only going to focus on the top 3 which is CNC EW and JAZZ as those were the clear standouts. All 3 have been strong leaders YTD and while they also scored very strong in Jan, they are still showing great numbers so one would expect the upside to continue.
CNC on the daily is trading in a new base as its above the 2016 high of $75.57. As a trader I will keep that level as a potential stop area but the longer term view on this name has serious potential. When you combine the long-term view (weekly and monthly) to some of the JXM scores, you have solid risk reward at these current levels.
The all time high is $83 which is something we will try use as our upside target in the short-term but would consider an add to position if price makes a new all time high.
Daily view

Hourly view (potential bull flag setup; upside continuation pattern)

Monthly view

To summarize this review; after analyzing the IBB, we determined a nice band of support is on the horizon which lead us to review the entire sector. After the micro analysis was completed, we set our eyes on CNC as a favorite play for the upcoming future. Levels of interest is above $75.57 on a closing basis with a short-term target of $83 with much longer term potential if we break $83.

Solid post
LikeLike