Don’t let the caption fool you, I didn’t scalp this for the entire 1000% (or 10x) and I actually know what I am doing but the 1000% return was on the table and upside probability outweighed the risk. I will explain more about this trade throughout this blog
We all know TSLA is on a massive tear, I talk about it some on stocktwits from time to time as its one of my core holdings.
The below chart shows the before and after of this massive breakout to put price into context
Before
After
Coming into June I was aware of its seasonality and intended to play some lotto call options to see if I can capture some lottery like returns.
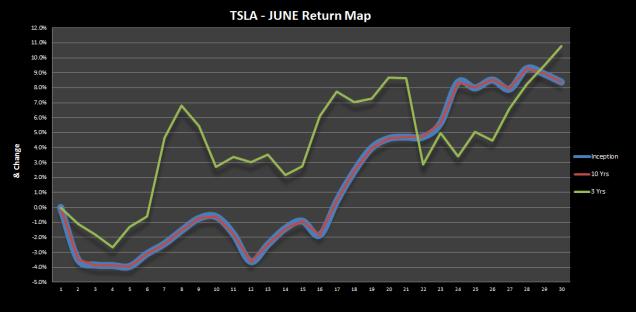
The next image is the Yearly return map for TSLA and at first glance you can see the May upside (which we got) then price tends to dip into the start of June and quickly makes new highs.
Here is the June visual without 2017. You will notice how strong June has been on average with the 3 year and inception lines topping out at around +9-11%.
Knowing this ahead of June (which we did) some lotto June calls were very interesting.
The low price for the June 350s were $3.10 with a high price of $34.00. If you caught the entire move, that’s a 10 bagger or the 1000% mentioned above.
Now lets take a look at the June return map with the 2017 line chart. You got the June average in 2017 right at mid month and now price has retraced some. While this could just be temporary, we closed out the trade right around when the common stock hit the +9.5% mark for June as we know option volatility and greed can hurt the pockets. This trade was > 500% return for us in short time
Lastly while TSLA is still in a massive uptrend, some of the trends are running hot and RSI and today’s candle are currently showing bearish. We will wait for the next setup where we can minimize risk and maximize returns


